|
Key Features
- Dynamic remote management of one or more SAN fabrics
- Fabric, switch, port and device-level viewpoints
- Intelligent diagnostics help identify faulty devices before
they fail
- Hardware, Broadcast and Name Server zoning
- Customizable event logging, printable reports
- Password security with individual read/write access levels
- Mass deployment toolset simplifies large fabric installation
and repair
- In-band (Fibre Channel) and out-of-band (Ethernet) access
- OSI-based architecture — implement any standard GUI via
Telnet, SNMP, HTML or SES
QLogic's SANsurfer™ Web-based management software allows IT
administrators to monitor and control their Storage Area Network
(SAN) installations via the Internet or Intranet. Powerful point-and-click
tools, delivered within a familiar Web interface setting, help make
QLogic SANs the world's easiest to optimize and maintain.
QLogic's OEM customers can also access SANsurfer's features through
their own GUI. The SANsurfer Web application is built on a robust,
yet flexible open systems foundation that integrates easily with
any standard management interface.
Application Overview
After passing a security login to establish read or read/write
privileges, the administrator uses a standard Java-based browser
to access the fabric through an Ethernet or Fibre Channel connection
to any single switch. From that entry point, the administrator interacts
with every other switch in the SAN, making configuration changes
and gathering a variety of useful topology, performance and diagnostics
information. Links to multiple switches can be implemented to ensure
that management capabilities are not interrupted if the first switch
is removed or brought offline.
Fabric Window
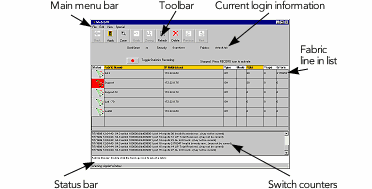
The Fabric Window, displayed when the GUI is first activated,
lists all managed fabrics, allowing the administrator to create
and edit new fabric names as needed. Diagnostics messages in the
bottom half of the screen are prioritized to highlight the most
important information, providing an "early warning system" to alert
the administrator to signs that a GBIC, disk drive or other fabric
component is functioning marginally prior to failure. Online help,
available throughout the application, suggests the best course of
action for each diagnostic scenario.
Topology Window
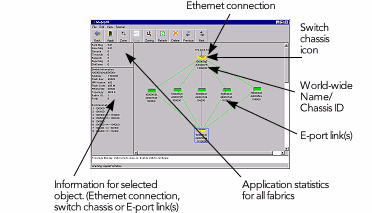
When a specific fabric is selected in the Fabric Window, the Topology
Window graphically displays the logical relationship of each switch
in the fabric. The switch name, domain ID, World-Wide Name (WWN)
and status of each chassis appears under its icon. In addition to
responding to "trap" notifications, the application polls the fabric
automatically to ensure an up-to-date display.
Chassis Window
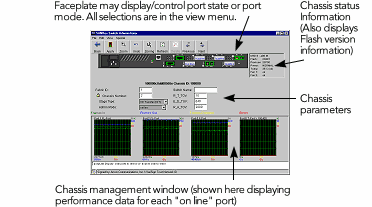
When an individual switch in the Topology Window is double-clicked,
SANsurfer activates the Chassis Window. This window is divided into
two parts. The upper portion shows the switch's faceplate, indicating
online/offline status and mode for each port. The bottom portion
can display Performance Metrics (the default setting, shown above),
Name Server, Trace Log, System Log or Memory Map information. Port
tuning and configuration are also accomplished from this screen.
Port Statistics/Loop Window
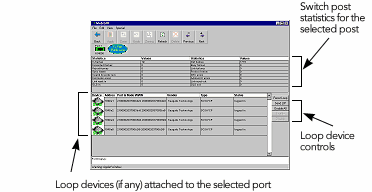
When an individual port in the Chassis Window is selected, SANsurfer
activates the Port Statistics/Loop Window, displaying statistics
for that port and, if it is a "loop" port (FL, SL or TL_port), information
about each device on the loop.
Zoning Window
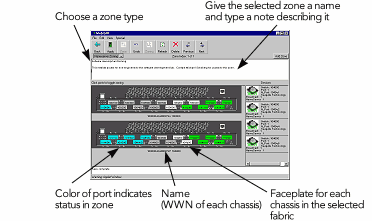
The Zoning Window allows ports to be configured into zones for
more efficient and secure communication among functionally grouped
devices. SAN administrators can choose to implement Broadcast or
Name Server zones for easy platform and technology segmentation
or apply Hard Zones for data security no hacker can penetrate.
| |
System Requirements |
|
|
Host support: Windows
NT, Windows 95/98, Unix |
 |
|
|
Java-based browser:
Netscape 4.51 and above, Internet Explorer 4.0 and above
|
|
|